The Expert view window
The Expert Clients/Servers view makes it easy to track events and to see them in the context of peer-to-peer or client-server traffic patterns.
To display events in the Expert Clients/Servers view:
1. Select Clients/Servers under Expert in the navigation bar of a capture window.
Pairs of nodes are displayed at the top level, individual conversations (flows) underneath them, and individual events nested under each flow. Color coded traffic indicator lights show whether or not packets were received in the last few seconds:
• green (active)
• light green (inactive)
Smaller LED lights appear to the right of the traffic indicators when an event has been detected:
• A red LED indicates one or more events whose severity is Major or Severe.
• A yellow LED indicates one or more events whose severity is Informational or Minor.
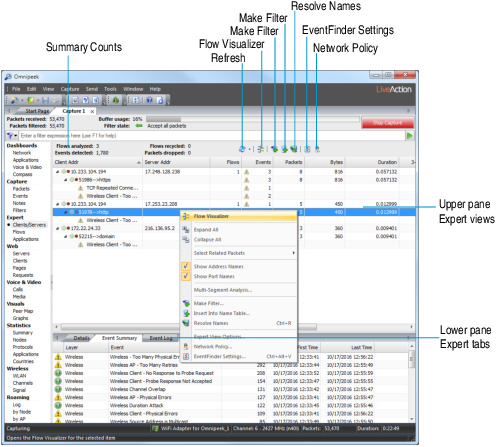
2. Right-click in the upper pane to collapse or expand the hierarchy to display the most relevant information. When expanded, Expert events are displayed by ports. Ports are shown with directional arrows.
TIP: In the Expert Clients/Servers view, sorting by Events can help pinpoint potential problems on your network.